Every QR code you own has its own analytics page — open-house weekends, campaign bursts, and long-tail visits, all on one chart.
Open it from any row in your Dashboard portfolio or any card in your Wallet. Every number on the page is about that one piece of print.
The numbers at a glance
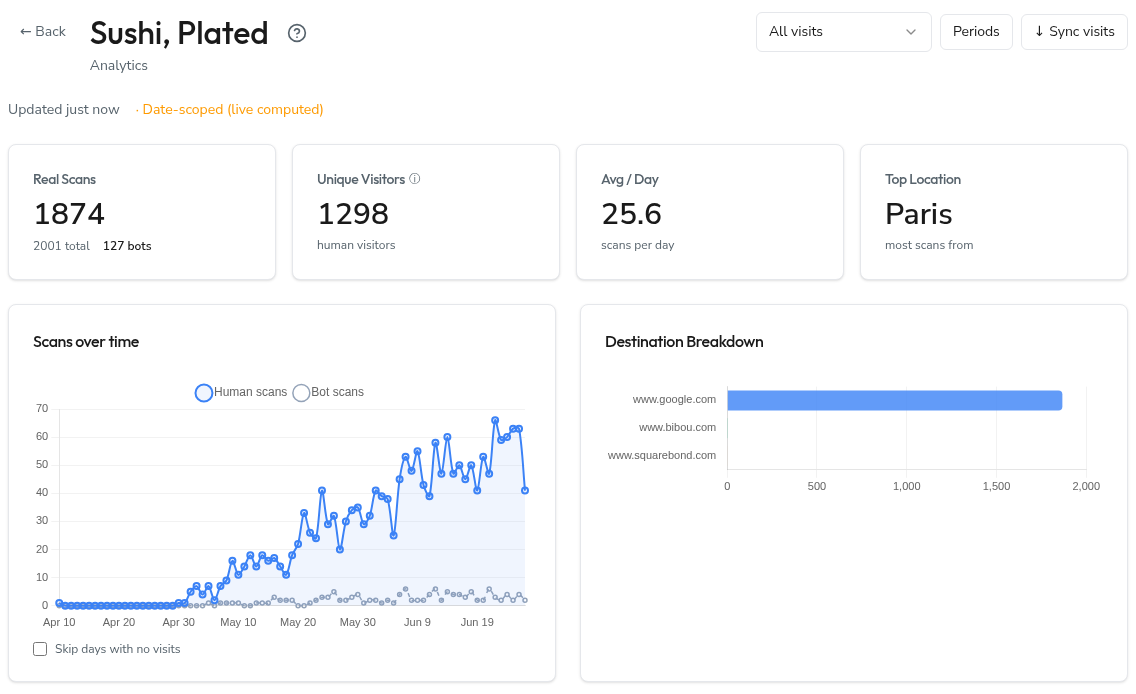
Above the chart, a row of cards summarises the period you've selected: total scans, real (human) visits, unique visitors, average scans per day, and your top city. They update the moment you change the period.

The chart
A visits-over-time line chart is the centrepiece. Two series overlay:
- Human scans — sessions consistent with a real person on a real device.
- Bot scans — every other resolution: crawlers, link-preview bots, and automated requests.
The gap between the two lines is how much noise your code is picking up. A code shared on social media sees a wider gap; one tucked inside a brochure handed to walk-ins sees very little.
Where your scans come from
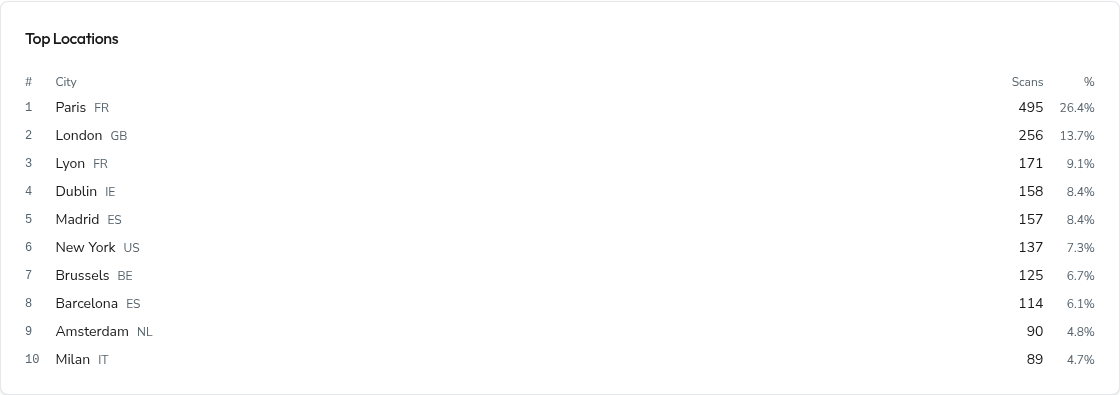
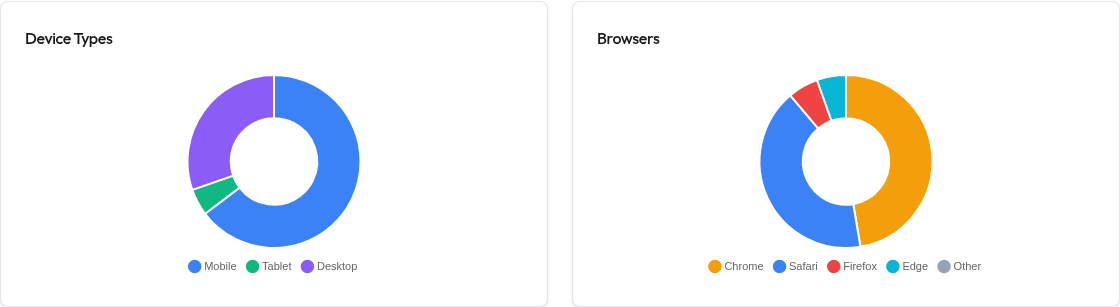
Two panels break your audience down: a geographic view (cities and countries ranked by share) and a device & browser split. Use them to confirm a code is being scanned where — and on what — you expect.
Measurement periods
Five built-in windows live in the period selector at the top:
- All visits — from your code's first scan until now.
- Last 7 days
- Last 30 days
- Last 90 days
- Custom — pick your own start and end dates.
For codes less than 90 days old, the preset windows clamp to your code's first visit — no dead air padding the left edge of the chart. A small note appears when this happens.
Custom windows and granularity
Pick a custom window of 72 hours or less and an hourly granularity toggle appears — ideal for micro-windows like a single open-house afternoon, an email send, or a targeted ad. Anything longer shows daily buckets.
Named periods
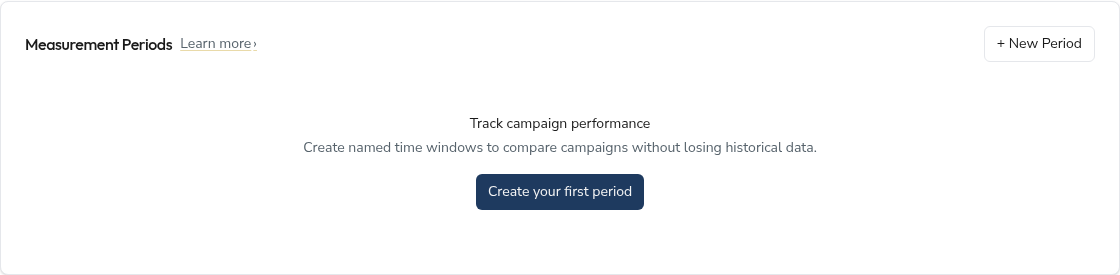
For recurring campaigns, save a named period ("Spring listings 2026", "Open House — 14 Mar") with its own start and end dates. Saved periods appear in the period selector and can be shared across all your codes if you mark them global. Create one from + New Period; manage existing ones from the same panel.
Syncing from the source
SquareBond aggregates visit data from the short-link service behind every dynamic QR. Most of the time this is automatic. Just ran a live event and want the numbers now rather than waiting for the next scheduled sync? Hit Sync — it pulls the latest visits from the source.
A gentle rate limit (you'll see a countdown if you sync too often) and a "sync in progress" lock keep two syncs from colliding on the same code. Both are there to keep things fast and consistent.
Bot analysis
Open the Bot analysis panel at the foot of the page to see how much automated traffic your code attracts: the bot rate (share of scans flagged automated), total bot scans, and human scans for the selected period.
Bot scans are excluded from every primary metric — the headline numbers and the Human scans line already filter them out. This panel is for inspecting crawler and preview-bot patterns, not for day-to-day reporting.

Putting it to work
- Spot the open-house spike. Pick "Last 7 days" the Monday after an open house; a clean Saturday spike means the sign worked.
- Compare two codes. Same flyer, two codes, one per agent — compare their pages after a weekend.
- Validate an email send. Set a custom 72-hour window from the send date, switch to hourly, watch the curve.
- Build a renewal case. All-time real visits across a listing's life is a clean number to put in front of a vendor.
Frequently asked questions
Why is "Real visits" lower than "Total visits"?
"Total" includes bots, crawlers, messaging-app link previews, and other automated requests. "Real visits" filters for what looks like a human on a device — use it when you're judging real-world reach.
What does "first visit" mean?
The timestamp of the first scan after the code was activated. The "All visits" window starts there; we don't pad empty dates before a code ever saw traffic.
Can I export the data?
CSV export is on the roadmap. For now, screenshots and the summary cards at the top of the page are the available views.
Does cancelling my plan wipe my analytics?
No — scan history stays tied to the code for as long as your account exists. But once a plan ends, the underlying dynamic link resets, so future scans of a printed code redirect to squarebond.com rather than your configured destination.